


Meramec township, St. Louis County, Missouri
About
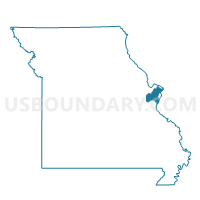
Outline

Summary
| Unique Area Identifier | 139710 |
| Name | Meramec township |
| County | St. Louis County |
| State | Missouri |
| Area (square miles) | 62.95 |
| Land Area (square miles) | 61.65 |
| Water Area (square miles) | 1.30 |
| % of Land Area | 97.94 |
| % of Water Area | 2.06 |
| Latitude of the Internal Point | 38.51980100 |
| Longtitude of the Internal Point | -90.61314430 |
| Total Population | 39,731 |
| Total Housing Units | 13,934 |
| Total Households | 13,407 |
| Median Age | 39.3 |
Maps


Graphs
Select a template below for downloading or customizing gragh for Meramec township, St. Louis County, Missouri


Neighbors
Neighoring County Subdivision (by Name) Neighboring County Subdivision on the Map
- Boles township, Franklin County, MO
- Bonhomme township, St. Louis County, MO
- Calvey township, Franklin County, MO
- Chesterfield township, St. Louis County, MO
- High Ridge township, Jefferson County, MO
- Meramec township, Jefferson County, MO
- Queeny township, St. Louis County, MO
- Rock township, Jefferson County, MO
- Wildhorse township, St. Louis County, MO
Top 10 Neighboring Place (by Population) Neighboring Place on the Map
- Wildwood city, MO (35,517)
- Ballwin city, MO (30,404)
- Eureka city, MO (10,189)
- Ellisville city, MO (9,133)
- Murphy CDP, MO (8,690)
- Pacific city, MO (7,002)
- Valley Park city, MO (6,942)
- Fenton city, MO (4,022)
- LaBarque Creek CDP, MO (1,558)
Top 10 Neighboring Unified School District (by Population) Neighboring Unified School District on the Map
- Parkway School District, MO (140,234)
- Rockwood School District, MO (116,321)
- Northwest R-I School District, MO (45,694)
- Meramec Valley R-III School District, MO (22,762)
- Valley Park School District, MO (8,427)
Top 10 Neighboring State Legislative District Lower Chamber (by Population) Neighboring State Legislative District Lower Chamber on the Map
- State House District 89, MO (38,194)
- State House District 93, MO (37,159)
- State House District 90, MO (36,548)
- State House District 84, MO (36,467)
- State House District 109, MO (35,780)
- State House District 105, MO (35,379)
- State House District 95, MO (33,750)
- State House District 88, MO (33,150)
Top 10 Neighboring State Legislative District Upper Chamber (by Population) Neighboring State Legislative District Upper Chamber on the Map
- State Senate District 26, MO (189,096)
- State Senate District 22, MO (176,515)
- State Senate District 15, MO (168,516)
- State Senate District 7, MO (160,542)
Top 10 Neighboring 111th Congressional District (by Population) Neighboring 111th Congressional District on the Map
- Congressional District 2, MO (706,622)
- Congressional District 9, MO (684,101)
- Congressional District 3, MO (625,251)
Top 10 Neighboring Census Tract (by Population) Neighboring Census Tract on the Map
- Census Tract 2214.22, St. Louis County, MO (8,870)
- Census Tract 8008, Franklin County, MO (7,649)
- Census Tract 8007.01, Franklin County, MO (7,308)
- Census Tract 2179.23, St. Louis County, MO (7,269)
- Census Tract 2215.03, St. Louis County, MO (7,235)
- Census Tract 7003.04, Jefferson County, MO (7,149)
- Census Tract 2214.21, St. Louis County, MO (6,679)
- Census Tract 2215.02, St. Louis County, MO (6,537)
- Census Tract 2179.44, St. Louis County, MO (5,967)
- Census Tract 7004.02, Jefferson County, MO (5,548)
Top 10 Neighboring 5-Digit ZIP Code Tabulation Area (by Population) Neighboring 5-Digit ZIP Code Tabulation Area on the Map
- 63021, MO (56,261)
- 63026, MO (44,124)
- 63049, MO (15,896)
- 63069, MO (15,647)
- 63025, MO (13,854)
- 63088, MO (8,269)
- 63038, MO (6,914)
Data
Demographic, Population, Households, and Housing Units
** Data sources from census 2010 **
Show Data on Map
Download Full List as CSV
Download Quick Sheet as CSV
| Subject | This Area | St. Louis County | Missouri | National |
|---|---|---|---|---|
| POPULATION | ||||
| Total Population Map | 39,731 | 998,954 | 5,988,927 | 308,745,538 |
| POPULATION, HISPANIC OR LATINO ORIGIN | ||||
| Not Hispanic or Latino Map | 39,001 | 973,930 | 5,776,457 | 258,267,944 |
| Hispanic or Latino Map | 730 | 25,024 | 212,470 | 50,477,594 |
| POPULATION, RACE | ||||
| White alone Map | 36,538 | 701,948 | 4,958,770 | 223,553,265 |
| Black or African American alone Map | 878 | 233,029 | 693,391 | 38,929,319 |
| American Indian and Alaska Native alone Map | 78 | 1,962 | 27,376 | 2,932,248 |
| Asian alone Map | 1,512 | 34,597 | 98,083 | 14,674,252 |
| Native Hawaiian and Other Pacific Islander alone Map | 18 | 307 | 6,261 | 540,013 |
| Some Other Race alone Map | 135 | 8,515 | 80,457 | 19,107,368 |
| Two or More Races Map | 572 | 18,596 | 124,589 | 9,009,073 |
| POPULATION, SEX | ||||
| Male Map | 19,999 | 472,903 | 2,933,477 | 151,781,326 |
| Female Map | 19,732 | 526,051 | 3,055,450 | 156,964,212 |
| POPULATION, AGE (18 YEARS) | ||||
| 18 years and over Map | 28,418 | 764,780 | 4,563,491 | 234,564,071 |
| Under 18 years | 11,313 | 234,174 | 1,425,436 | 74,181,467 |
| POPULATION, AGE | ||||
| Under 5 years | 2,366 | 58,606 | 390,237 | 20,201,362 |
| 5 to 9 years | 3,253 | 62,946 | 390,463 | 20,348,657 |
| 10 to 14 years | 3,539 | 67,920 | 396,925 | 20,677,194 |
| 15 to 17 years | 2,155 | 44,702 | 247,811 | 12,954,254 |
| 18 and 19 years | 914 | 26,252 | 175,975 | 9,086,089 |
| 20 years | 350 | 11,643 | 86,528 | 4,519,129 |
| 21 years | 328 | 11,311 | 83,511 | 4,354,294 |
| 22 to 24 years | 1,060 | 37,266 | 243,250 | 12,712,576 |
| 25 to 29 years | 1,610 | 63,786 | 403,239 | 21,101,849 |
| 30 to 34 years | 2,068 | 58,065 | 372,228 | 19,962,099 |
| 35 to 39 years | 2,701 | 58,640 | 368,070 | 20,179,642 |
| 40 to 44 years | 3,368 | 64,123 | 380,546 | 20,890,964 |
| 45 to 49 years | 3,928 | 76,494 | 444,766 | 22,708,591 |
| 50 to 54 years | 3,632 | 79,105 | 443,806 | 22,298,125 |
| 55 to 59 years | 2,773 | 70,200 | 389,985 | 19,664,805 |
| 60 and 61 years | 940 | 24,940 | 140,830 | 7,113,727 |
| 62 to 64 years | 1,238 | 33,462 | 192,463 | 9,704,197 |
| 65 and 66 years | 573 | 17,898 | 108,394 | 5,319,902 |
| 67 to 69 years | 720 | 24,533 | 148,659 | 7,115,361 |
| 70 to 74 years | 793 | 31,812 | 193,437 | 9,278,166 |
| 75 to 79 years | 583 | 27,905 | 155,271 | 7,317,795 |
| 80 to 84 years | 422 | 23,749 | 118,754 | 5,743,327 |
| 85 years and over | 417 | 23,596 | 113,779 | 5,493,433 |
| MEDIAN AGE BY SEX | ||||
| Both sexes Map | 39.30 | 39.90 | 37.90 | 37.20 |
| Male Map | 38.40 | 37.90 | 36.50 | 35.80 |
| Female Map | 40.10 | 41.60 | 39.20 | 38.50 |
| HOUSEHOLDS | ||||
| Total Households Map | 13,407 | 404,765 | 2,375,611 | 116,716,292 |
| HOUSEHOLDS, HOUSEHOLD TYPE | ||||
| Family households: Map | 10,964 | 263,423 | 1,552,133 | 77,538,296 |
| Husband-wife family Map | 9,400 | 189,432 | 1,150,929 | 56,510,377 |
| Other family: Map | 1,564 | 73,991 | 401,204 | 21,027,919 |
| Male householder, no wife present Map | 430 | 16,338 | 109,000 | 5,777,570 |
| Female householder, no husband present Map | 1,134 | 57,653 | 292,204 | 15,250,349 |
| Nonfamily households: Map | 2,443 | 141,342 | 823,478 | 39,177,996 |
| Householder living alone Map | 2,044 | 119,346 | 672,276 | 31,204,909 |
| Householder not living alone Map | 399 | 21,996 | 151,202 | 7,973,087 |
| HOUSEHOLDS, HISPANIC OR LATINO ORIGIN OF HOUSEHOLDER | ||||
| Not Hispanic or Latino householder: Map | 13,236 | 397,741 | 2,319,445 | 103,254,926 |
| Hispanic or Latino householder: Map | 171 | 7,024 | 56,166 | 13,461,366 |
| HOUSEHOLDS, RACE OF HOUSEHOLDER | ||||
| Householder who is White alone | 12,698 | 298,683 | 2,020,416 | 89,754,352 |
| Householder who is Black or African American alone | 124 | 87,366 | 259,539 | 14,129,983 |
| Householder who is American Indian and Alaska Native alone | 24 | 725 | 10,427 | 939,707 |
| Householder who is Asian alone | 422 | 11,503 | 31,808 | 4,632,164 |
| Householder who is Native Hawaiian and Other Pacific Islander alone | 3 | 94 | 1,605 | 143,932 |
| Householder who is Some Other Race alone | 26 | 2,162 | 20,727 | 4,916,427 |
| Householder who is Two or More Races | 110 | 4,232 | 31,089 | 2,199,727 |
| HOUSEHOLDS, HOUSEHOLD TYPE BY HOUSEHOLD SIZE | ||||
| Family households: Map | 10,964 | 263,423 | 1,552,133 | 77,538,296 |
| 2-person household Map | 4,005 | 115,781 | 699,051 | 31,882,616 |
| 3-person household Map | 2,519 | 62,472 | 352,533 | 17,765,829 |
| 4-person household Map | 2,858 | 51,171 | 289,496 | 15,214,075 |
| 5-person household Map | 1,181 | 22,497 | 133,129 | 7,411,997 |
| 6-person household Map | 302 | 7,614 | 49,302 | 3,026,278 |
| 7-or-more-person household Map | 99 | 3,888 | 28,622 | 2,237,501 |
| Nonfamily households: Map | 2,443 | 141,342 | 823,478 | 39,177,996 |
| 1-person household Map | 2,044 | 119,346 | 672,276 | 31,204,909 |
| 2-person household Map | 340 | 18,678 | 123,465 | 6,360,012 |
| 3-person household Map | 42 | 2,403 | 17,929 | 992,156 |
| 4-person household Map | 11 | 691 | 7,052 | 411,171 |
| 5-person household Map | 4 | 150 | 1,848 | 126,634 |
| 6-person household Map | 1 | 36 | 559 | 48,421 |
| 7-or-more-person household Map | 1 | 38 | 349 | 34,693 |
| HOUSING UNITS | ||||
| Total Housing Units Map | 13,934 | 438,032 | 2,712,729 | 131,704,730 |
| HOUSING UNITS, OCCUPANCY STATUS | ||||
| Occupied Map | 13,407 | 404,765 | 2,375,611 | 116,716,292 |
| Vacant Map | 527 | 33,267 | 337,118 | 14,988,438 |
| HOUSING UNITS, OCCUPIED, TENURE | ||||
| Owned with a mortgage or a loan Map | 9,975 | 214,135 | 1,118,792 | 52,979,430 |
| Owned free and clear Map | 2,114 | 77,802 | 514,818 | 23,006,644 |
| Renter occupied Map | 1,318 | 112,828 | 742,001 | 40,730,218 |
| HOUSING UNITS, VACANT, VACANCY STATUS | ||||
| For rent Map | 111 | 12,632 | 92,946 | 4,137,567 |
| Rented, not occupied Map | 6 | 650 | 4,290 | 206,825 |
| For sale only Map | 174 | 6,846 | 44,200 | 1,896,796 |
| Sold, not occupied Map | 28 | 1,362 | 11,098 | 421,032 |
| For seasonal, recreational, or occasional use Map | 74 | 2,072 | 80,374 | 4,649,298 |
| For migrant workers Map | 0 | 4 | 193 | 24,161 |
| Other vacant Map | 134 | 9,701 | 104,017 | 3,652,759 |
| HOUSING UNITS, OCCUPIED, AVERAGE HOUSEHOLD SIZE BY TENURE | ||||
| Total: Map | 2.86 | 2.42 | 2.45 | 2.58 |
| Owner occupied Map | 2.92 | 2.52 | 2.54 | 2.65 |
| Renter occupied Map | 2.31 | 2.16 | 2.25 | 2.44 |
| HOUSING UNITS, OCCUPIED, TENURE BY RACE OF HOUSEHOLDER | ||||
| Owner occupied: Map | 12,089 | 291,937 | 1,633,610 | 75,986,074 |
| Householder who is White alone Map | 11,469 | 235,823 | 1,474,738 | 63,446,275 |
| Householder who is Black or African American alone Map | 84 | 45,531 | 110,128 | 6,261,464 |
| Householder who is American Indian and Alaska Native alone Map | 16 | 417 | 6,019 | 509,588 |
| Householder who is Asian alone Map | 409 | 6,988 | 17,427 | 2,688,861 |
| Householder who is Native Hawaiian and Other Pacific Islander alone Map | 3 | 53 | 600 | 61,911 |
| Householder who is Some Other Race alone Map | 20 | 843 | 8,794 | 1,975,817 |
| Householder who is Two or More Races Map | 88 | 2,282 | 15,904 | 1,042,158 |
| Renter occupied: Map | 1,318 | 112,828 | 742,001 | 40,730,218 |
| Householder who is White alone Map | 1,229 | 62,860 | 545,678 | 26,308,077 |
| Householder who is Black or African American alone Map | 40 | 41,835 | 149,411 | 7,868,519 |
| Householder who is American Indian and Alaska Native alone Map | 8 | 308 | 4,408 | 430,119 |
| Householder who is Asian alone Map | 13 | 4,515 | 14,381 | 1,943,303 |
| Householder who is Native Hawaiian and Other Pacific Islander alone Map | 0 | 41 | 1,005 | 82,021 |
| Householder who is Some Other Race alone Map | 6 | 1,319 | 11,933 | 2,940,610 |
| Householder who is Two or More Races Map | 22 | 1,950 | 15,185 | 1,157,569 |
| HOUSING UNITS, OCCUPIED, TENURE BY HISPANIC OR LATINO ORIGIN OF HOUSEHOLDER | ||||
| Owner occupied: Map | 12,089 | 291,937 | 1,633,610 | 75,986,074 |
| Not Hispanic or Latino householder Map | 11,944 | 288,259 | 1,605,838 | 69,617,625 |
| Hispanic or Latino householder Map | 145 | 3,678 | 27,772 | 6,368,449 |
| Renter occupied: Map | 1,318 | 112,828 | 742,001 | 40,730,218 |
| Not Hispanic or Latino householder Map | 1,292 | 109,482 | 713,607 | 33,637,301 |
| Hispanic or Latino householder Map | 26 | 3,346 | 28,394 | 7,092,917 |
| HOUSING UNITS, OCCUPIED, TENURE BY HOUSEHOLD SIZE | ||||
| Owner occupied: Map | 12,089 | 291,937 | 1,633,610 | 75,986,074 |
| 1-person household Map | 1,554 | 71,322 | 369,640 | 16,453,569 |
| 2-person household Map | 3,991 | 104,553 | 629,004 | 27,618,605 |
| 3-person household Map | 2,353 | 48,535 | 262,364 | 12,517,563 |
| 4-person household Map | 2,712 | 41,249 | 221,292 | 10,998,793 |
| 5-person household Map | 1,106 | 17,713 | 97,390 | 5,057,765 |
| 6-person household Map | 283 | 5,751 | 34,420 | 1,965,796 |
| 7-or-more-person household Map | 90 | 2,814 | 19,500 | 1,373,983 |
| Renter occupied: Map | 1,318 | 112,828 | 742,001 | 40,730,218 |
| 1-person household Map | 490 | 48,024 | 302,636 | 14,751,340 |
| 2-person household Map | 354 | 29,906 | 193,512 | 10,624,023 |
| 3-person household Map | 208 | 16,340 | 108,098 | 6,240,422 |
| 4-person household Map | 157 | 10,613 | 75,256 | 4,626,453 |
| 5-person household Map | 79 | 4,934 | 37,587 | 2,480,866 |
| 6-person household Map | 20 | 1,899 | 15,441 | 1,108,903 |
| 7-or-more-person household Map | 10 | 1,112 | 9,471 | 898,211 |
Loading...